Lies, damn lies and statistics – REDWatch comments on the Waterloo demographic reports
We have an example of this already in the poor demographic analysis in the GHD Social Baseline Report and Population and Demographic Study under taken by id. Both of these reports cover the Waterloo Metro and Estate SSP sites.
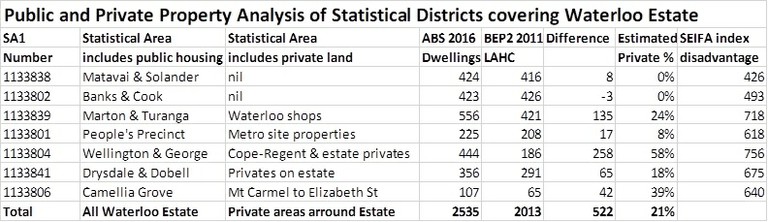
The smallest area for the release of Census data is the Statistical Area level 1 (SA1). These areas can contain between 200 and 800 people and in the case of the seven SA1 used to describe the “Waterloo SSP” only two of the seven Statistical Areas exclusively cover public housing; the other five also include private housing. The seven SA1 include around 522 non LAHC homes which make up about 21% of all the homes included in the reports as part of the “Waterloo SSP”. The table below indicates the SA1s and the public and private dwellings recorded in the 2016 census.
The demographic study says there are 3,647 residents living in the above Waterloo Precinct in 2016, which it, and the social baseline report, then use to profile this area. This is not the Waterloo Estate nor does it reflect the estate’s demographics.
The SEIFA index of disadvantage (the lower the number the more disadvantaged) illustrates this. The two estate-only SA1s have an index of 493 and 426, while the other five have indexes between 756 and 618. This reflects the statistical impact of the well-off private owners or renters who live adjacent to the estate.
The specific needs of public housing tenants will be obscured even more after a 70% private / 30% social housing redevelopment. On average, the area will look fine, but the actual disadvantage of public housing tenants will not have diminished.
The SSP demographic reports do not unpack the above data issues. Nor do they even mention that private residents are included. They similarly do not look at the long known issues of low Census completion rates in public housing, nor the potential under-reporting of unregistered tenants. The latter problem was likely to be greater in the 2016 Census because of the announcement that Census data would be shared with other parts of government – a major fear for some tenants who worried that by including unauthorised tenants they may self-incriminate, which might impact their benefits or the rent they pay. These are just some of the many issues.
In most cases, people reading the reports will just assume that the figures reflect what is happening on the estate when they do not. In the GHD Social Baseline report, they go further after using the SA1 data, and infer that this area represents only the estate. Graph 4.2.7 shows tenure comparisons between Waterloo and the City of Sydney LGA but it did not graph the Waterloo precinct because “Tenure for Waterloo Estate has not been included in this figure as all residents are social housing tenants”. Had they graphed the SA1s data being used, it would have shown a significant number of owners and private renters. The graph would also have shown that the Census showed only 1425 respondents reported they lived in social housing. This is far short of the over 2012 public housing units covered by the seven SA1s.
The GHD report does say FACS told them there were 3,585 residents living on the estate. In response to my request to LAHC for the basis for this figure, they do not know where the figure came from, other than that it is close to the combined SA1s’ resident figures of 3652. Sydney Council use an average of 1.9 occupants per unit and for the 2012 properties this could indicate around 3800 people live on the estate. There is reason to believe, because of the number of lone occupants, that 1.9 is too high for the estate. The FACS official tenant figure of 2,630 for Waterloo works out about 1.3 tenants per home. On its projections id seem to have used a figure lower than that used by the City without making it clear what occupation figure was used nor how the calculation was made.
GHD do quote some other LAHC supplied figures about the estate and these seem to correspond to the figures shown in LAHC’s Waterloo Public Housing Renewal - Existing Property official occupation released in late 2017.
After going through the two reports, we have no better understanding of how many people might live on the estate. The reports often do not make clear their data set or their methodologies and jump between what they are describing. Not even LAHC believe that there are only the 2,630 people who are shown in the document referred to above as officially occupying LAHC housing on the Waterloo estate. There might be around 3,600 people living on the estate but no one knows. Certainly, the ABS demographics for the SA1s do not adequately describe the people who live in public housing.
We also do not have a clearer idea of what the needs might be for tenants as the ABS figures are distorted by the 21% private returns. As an example, the LAHC figures above, show that 30% of tenants are on Disability Support Pensions and that around 18% need assistance. The GHD report puts the need for assistance at only 11%, while anecdotally health workers put it at well over 20%. It has also been over 12 months since LAHC released its Waterloo figures. FACS has recently completed client visits to all Waterloo tenants covered by the redevelopment, so it should now have a clearer idea of its tenants needs and be able to update the figures released in late 2017.
Naively we hoped that the demographic studies might help us better understand the public housing community who will be impacted by the redevelopment and who will be a key part of the future community. Instead, the report proceeds from the assumption that the SA1s accurately describe the community and then project in an opaque way the extra 5000 to 5533 units from there. Worryingly, these reports might do enough to help justify an increase in density in Waterloo. But, these reports do not accurately reflect the demographics of the Waterloo public housing tenants. They should not be the basis used to build a robust master plan or human services plan that will meet the needs of public tenants into the future.
This analysis was produced by Geoff Turnbull for REDWatch 11 January 2019.
